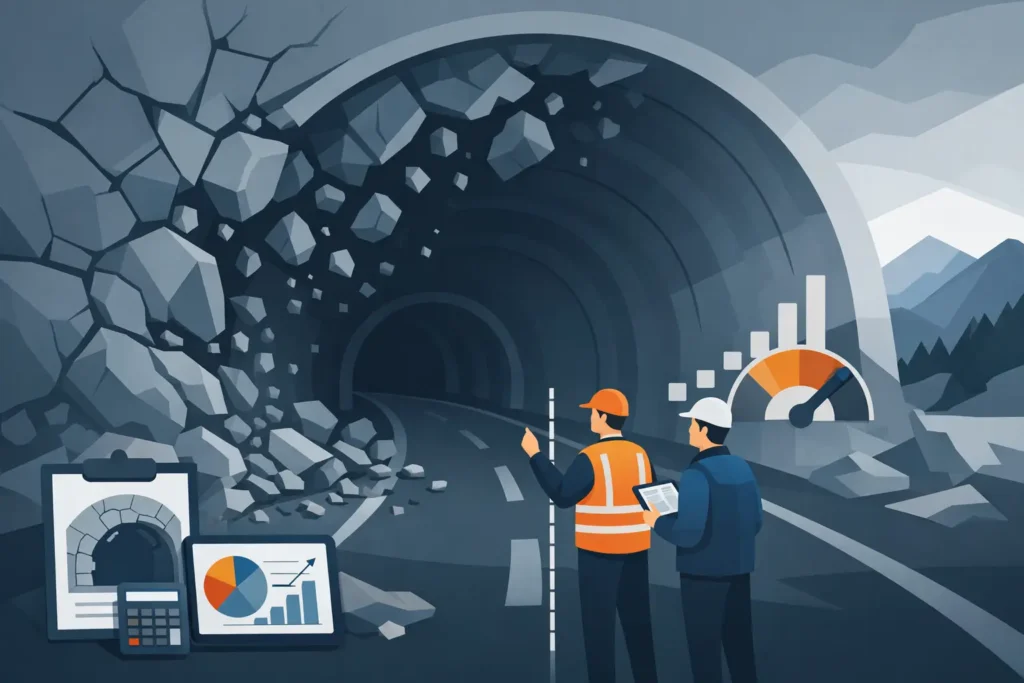
Overbreak is rarely caused by one poor blast round. It is usually the visible result of variable rock mass conditions, excavation energy, drilling accuracy and the way the designed profile has been interpreted underground. To understand how to calculate tunnel overbreak risk, the engineer needs to quantify both the likely excess excavation and the uncertainty around it.
For drill-and-blast tunnels in particular, a single deterministic allowance is useful for estimating quantities, but it does not describe risk. A risk calculation should show the chance that overbreak will exceed an agreed limit, the potential volume involved and the consequences for support, cost, schedule and neighbouring ground.
Define what overbreak means for the project
Start with a clear reference profile. This may be the theoretical excavation line, a payment profile, or a support excavation profile allowing for systematic rock reinforcement and sprayed concrete. Confusion between these profiles is a frequent cause of inconsistent reporting.
At chainage x, the measured overbreak area can be expressed as:
`Aob(x) = Ameasured(x) – Adesign(x)`
where `Ameasured` is the surveyed excavation area and `Adesign` is the relevant specified profile area. Negative values represent underbreak and should normally be recorded separately rather than allowed to offset overbreak in a volume calculation.
The overbreak volume over a tunnel section is then:
`Vob = ∫ Aob(x) dx`
In routine production control, this integral is commonly calculated from surveyed sections at a defined spacing. With areas measured at sections separated by length `ΔL`, a practical approximation is:
`Vob ≈ Σ [(Aob,i + Aob,i+1) / 2] × ΔL`
The calculation is straightforward. The engineering judgement lies in selecting the correct design line, survey interval and treatment of local cavities, wedges and probe-hole intersections.
Separate quantity from risk
An observed overbreak volume tells the team what has happened. Risk asks what may happen in future rounds or in the next geological domain. These are different questions.
A useful risk output combines probability and consequence:
`Risk = P(overbreak exceeds limit) × Consequence`
The limit may be expressed as an area per section, a radial deviation, a volume per metre, or a total volume for a defined reach. The most suitable measure depends on the decision. Radial deviation is often best for assessing support thickness and clearance. Volume per metre is normally more useful for concrete quantities, spoil handling and cost forecasting.
Consequences should not be reduced to excavation volume alone. Excessive overbreak can increase sprayed-concrete demand, create locally thicker linings, expose poorer rock, affect bolt lengths and complicate waterproofing. In sensitive locations it may also increase ground movement or reduce the cover to a nearby structure.
Build an input model that reflects the tunnel face
The calculation should use parameters that can be observed, checked and updated during excavation. Rock mass quality is central, but a single classification value is not enough. Structure orientation relative to the contour, joint persistence, block size, weathering, water and stress condition can each change contour stability substantially.
For a drill-and-blast excavation, the main input groups are geological, operational and geometric.
Geological inputs include the frequency and orientation of discontinuities, intact rock strength, weathering, water inflow, fault zones and the expected range of rock mass quality. A competent but heavily jointed rock mass can produce more contour loss than weaker massive rock, especially where joints daylight towards the opening.
Operational inputs include drill-hole deviation, burden and spacing at the contour, charge concentration, decoupling ratio, initiation sequence, advance length, explosive type and the experience of the drill-and-blast crew. Perimeter control is often dominated by drilling accuracy. A well-designed smooth-blasting pattern cannot compensate fully for collars placed inaccurately or holes that deviate towards the rock mass.
Geometric inputs cover tunnel span, profile curvature, location of the springline and crown, and proximity to niches, cross-passages or widening. Overbreak is not distributed uniformly. The crown and upper shoulders may be more vulnerable to block fall-out, whereas local damage around the invert can have different operational causes.
Establish a baseline from comparable rounds
The strongest starting point is measured data from the same tunnel, or from a genuinely comparable rock mass and excavation method. Use surveyed profiles to calculate overbreak area and volume per metre for completed rounds, then group the results by geological domain, tunnel geometry and blast design.
Do not rely only on average overbreak. An average hides the events that drive support cost and programme disturbance. For each domain, examine the median, upper percentile and maximum observed value. The 80th or 90th percentile is often more useful than the mean when planning allowances and deciding whether perimeter control needs intervention.
For example, a domain may show a mean overbreak of 0.7 m³/m but a 90th percentile of 1.8 m³/m. If the project threshold is 1.5 m³/m, the risk is clearly not described by the average. The relevant question becomes how often the threshold is exceeded and whether the excess occurs at locations where consequences are high.
Where project data are sparse, use ranges based on geological interpretation and experience, then state the uncertainty openly. Early estimates should not be presented with false precision. As laser scanning and face mapping become available, the model should be recalibrated.
Calculate the probability of exceeding a limit
A practical first method is an empirical exceedance calculation. If 12 out of 80 comparable rounds exceed the selected limit, the observed probability is:
`P(exceedance) = 12 / 80 = 0.15`
This suggests a 15% exceedance probability for similar conditions. The result must be treated carefully when the sample is small, when rounds are not independent, or when conditions are changing rapidly. A developing fault zone should not be assessed solely from production data in competent rock behind the face.
For planning and design-stage assessment, a scenario or probabilistic model is normally more appropriate. Define ranges or distributions for the uncertain inputs: for example, drill deviation, blast damage depth, wedge depth at the crown and rock mass class. Calculate the resulting overbreak volume for many combinations of those inputs. The proportion of simulations above the limit gives the estimated probability of exceedance.
A simplified section-based model can express radial overbreak as:
`dob = ddrill + dblast + dstructure`
where `ddrill` is contour displacement caused by drilling deviation, `dblast` is blast-induced damage or breakage beyond the intended contour, and `dstructure` is additional loss from structurally controlled blocks or wedges. These terms are not always independent. Poor rock mass conditions can make a given blast damage depth more consequential, so correlated inputs should be considered where data permit.
Convert the radial loss to area and volume using the local profile geometry. For small, approximately uniform radial loss, the added area can be estimated from the profile perimeter multiplied by the radial loss. For irregular wedges and cavities, use the surveyed geometry directly. The latter is preferable whenever detailed scan data are available.
Weight the consequences by location
Two rounds with the same excess volume can have very different implications. Overbreak at the crown beneath shallow cover, near a settlement-sensitive zone, or at a future waterproofed lining may justify a lower trigger value than overbreak in a low-consequence access tunnel.
A simple consequence scale can distinguish cost, support requirement, programme effect and third-party impact. It is often helpful to define actions against risk bands rather than treating the calculation as a reporting exercise. A low risk may require normal monitoring. A moderate risk may trigger a review of contour drilling and charge loading. A high risk may require shorter rounds, revised perimeter charges, additional probing, immediate support changes or a reassessment of the geological model.
The calculation should also distinguish systematic and local overbreak. Systematic overbreak across many rounds points towards pattern design, drilling practice or profile setting-out. A single deep cavity may be geologically controlled and should be assessed for stability and support, but it does not necessarily justify changing the full blast design.
Use field measurement as a control loop
Laser scanning after mucking, combined with reliable chainage and a consistent design profile, gives the most useful basis for updating the risk model. Face mapping, drill logs, charge records and support observations should be stored with the survey results. Without that connection, the team can measure overbreak accurately but still struggle to explain it.
Review the results by geological domain and by blast crew or pattern revision. If a change in contour charge, decoupling or drilling procedure reduces the upper percentile while maintaining advance and fragmentation, that is more meaningful than a one-round improvement. Conversely, a rising trend in overbreak can be an early warning that the rock mass model no longer represents the face conditions.
A good tunnel overbreak risk calculation is therefore not a one-off design value. It is a transparent, updateable estimate based on the excavation profile, measured performance and the mechanisms that can remove rock beyond the contour. Keep the model simple enough for site use, but detailed enough to show why the risk changes from one tunnel reach to the next.